Java剖析工具JProfiler可与多种IDE和应用服务器集成,本文主要介绍jprofiler与IntelliJ IDEA集成的全步骤。
1、在JProfiler的主菜单中选择Session->IDE integrations。值得注意的是,当执行插件安装时,需要关闭IntelliJ IDEA。如果通过JProfiler的安装向导执行安装程序,启动IntelliJ IDEA前需要完成整个安装。
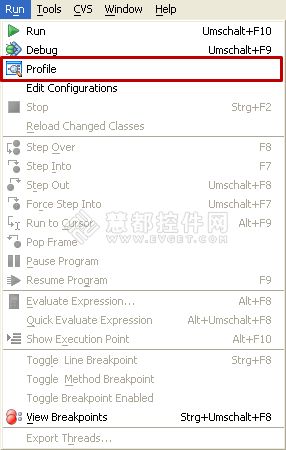
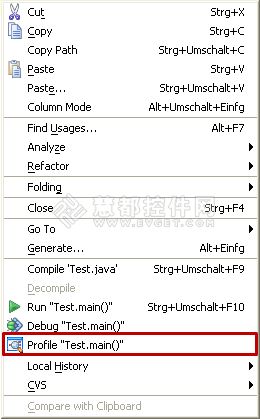
2、为了通过IntelliJ IDEA分析应用程序,需要选择Run菜单中的其中一个profile命令,或者编辑器中的上下文菜单,或者点击相应的工具栏按钮。
![http://image.evget.com/images/article/2013/ide_idea4_menu.jpg]()
"Run" menu with "Profile" action
![http://image.evget.com/images/article/2013/ide_idea4_context.jpg]()
Editor context menu with "Profile" action
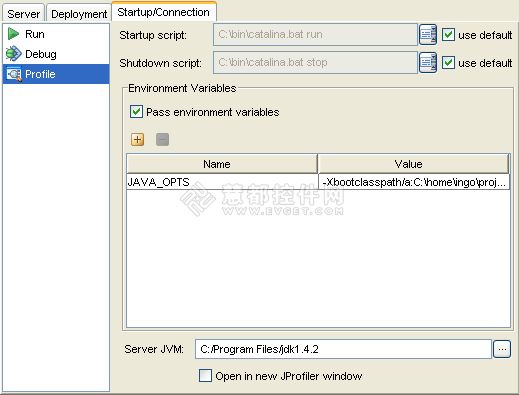
3、JProfiler可以从所有的IDEA或者应用服务器中分析所有的运行配置类型。编辑运行配置,选择"Startup/Connection" 选项卡,然后选择"Profile" 可以进行进一步的配置。下列截图显示了本地服务器配置的启动设置。根据运行配置类型,您可以调整JVM选项或检索分析参数,进行远程分析。
![http://image.evget.com/images/article/2013/ide_idea4_server.jpg]()
Startup settings for profiling of a local server configuration
4、对于所有的运行配置类型,你可以决定是否要在JProfiler打开一个新的分析会话窗口,或者希望重用最后一个窗口以适应分析会话。
5、点击“Run”命令,开始分析应用程序。如果当时没有正在运行的JProfiler实例,仍会启动JProfiler,否则所运行的JProfiler实例将用于呈现分析数据。
1、在JProfiler的主菜单中选择Session->IDE integrations。值得注意的是,当执行插件安装时,需要关闭IntelliJ IDEA。如果通过JProfiler的安装向导执行安装程序,启动IntelliJ IDEA前需要完成整个安装。
2、为了通过IntelliJ IDEA分析应用程序,需要选择Run菜单中的其中一个profile命令,或者编辑器中的上下文菜单,或者点击相应的工具栏按钮。
"Run" menu with "Profile" action
Editor context menu with "Profile" action
3、JProfiler可以从所有的IDEA或者应用服务器中分析所有的运行配置类型。编辑运行配置,选择"Startup/Connection" 选项卡,然后选择"Profile" 可以进行进一步的配置。下列截图显示了本地服务器配置的启动设置。根据运行配置类型,您可以调整JVM选项或检索分析参数,进行远程分析。
Startup settings for profiling of a local server configuration
4、对于所有的运行配置类型,你可以决定是否要在JProfiler打开一个新的分析会话窗口,或者希望重用最后一个窗口以适应分析会话。
5、点击“Run”命令,开始分析应用程序。如果当时没有正在运行的JProfiler实例,仍会启动JProfiler,否则所运行的JProfiler实例将用于呈现分析数据。